Nginx Deployment with Helm
Getting Nginx running in a cluster is a quite common task, but it was not yet done in this series of articles about a K3D cluster with a tiny NodeJS application and a lot of instrumentation around it. We are going to use the Bitnami helm chart and offer a simple static HTML site with all the entry points to the components running in the cluster.
The local K3D cluster grew quite substantially over time, and it became hard to tell the story. So we are now setting up an Nginx server and simplifying the navigation within the whole system through a simple home page. This is what we have available so far:
- K3D cluster with Ingress-Nginx,
- A NodeJS application exporting metrics for Prometheus and Grafana running locally, with Health Endpoints implemented,
- Alertmanager running locally, with Slack alerts,
- FluentBit and InfluxDB running locally to process application logs,
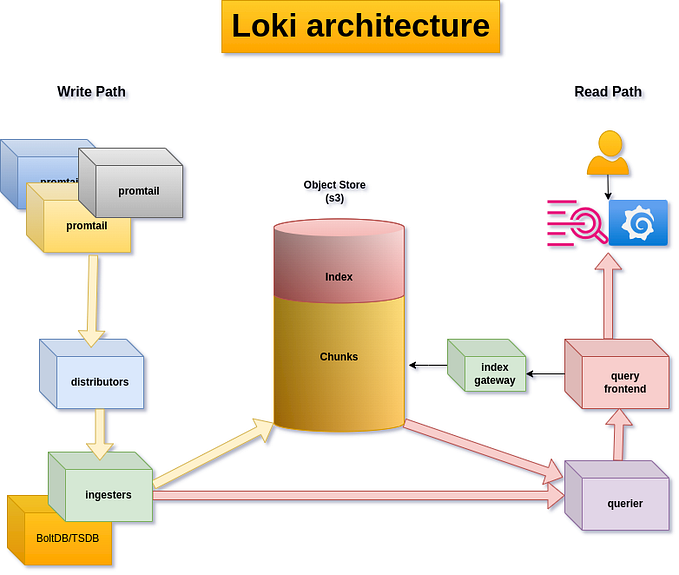
- Grafana Cloud with Loki, Prometheus and Grafana hosted by Grafana as an alternative to the local Promentheus/InfluxDB/Grafana instances,
- Goldilocks for resource estimates,
- Keda for autoscaling, and the
- Kubernetes Dashboard.
We are now adding Nginx using Bitnami’s Helm chart, and we generate a single HTML page that conveniently shows all the entry points and a lot of version information of applications running in the cluster. The screenshot below was taken from that home page with all features enabled.

After installation, if some system setting was changed, it is needed to run ./nginx-index.sh to update the HTML content based on the actual cluster installation.
Update February 13, 2022: There is a newer version of the software here with several updates.
What you need to bring, how to install everything
If you are using Windows: you can use Windows Subsystem for Linux to have a clean installation. A recent Windows 10 or 11 system will do fine, or a Ubuntu-alike Linux machine, better with 8 GB or more RAM. A basic understanding of bash, git, Docker, Kubernetes, Grafana, and NodeJS is expected. For the full setup you will need a Slack account for receiving alert messages, and a Grafana Cloud account to use Grafana Cloud, but these are optional, and disabled by default.
All source code is available at Github via https://github.com/klaushofrichter/nginx. The source code includes bash scripts and NodeJS code. As always, you should inspect code like this before you execute it on your machine, to make sure that no bad things happen.
The Windows Subsystem for Linux setup process is described in an earlier article. You should do the same steps for this setup, except using the newer repository. There is a new configuration option in config.sh, enabled by default:
export NGINX_ENABLE="yes" # or "no"The NGINX_ENABLE="yes" line will get you Nginx deployed. Most other feature flags are per default “no” so speed up the initial setup. You can always add or remove components dynamically later.
TL;DR
The super-short instruction is this: if you are using Windows, install Docker Desktop, use WSL to create a Linux environment, clone the repository, run setup.sh and start.sh on the Linux side and that’s it. If you are on Linux, you need docker, and you can also run setup.sh for some other tools like jq, nodejs, etc, but it’s probably better to do this manually to avoid conflicts with existing installations.
Then visit http://localhost:8080/ to see the Home page for this cluster, served by a fresh Nginx instance.
Getting started with Bitnami’s Helm Values file
Helm charts are offering convenience and usually reduce the chance of misconfiguration as several components may be packaged and some naming conventions are automated. We take advantage of this and use Bitnami’s Nginx Helm chart, which works well. Only a subset of the features is used here, including:
- static HTML pages maintained in a git repository,
- local HTML pages from a config map,
- autoscale using Horizontal Pod Autoscale (HPA),
- Ingress-Nginx integration,
- metrics exporter with Prometheus rules and a suitable Grafana Dashboard.
Let’s review the values file; see nginx-values.yaml.template:
resources:
  limits:
    cpu: 10m
    memory: 40Mi
  requests:
    cpu: 5m
    memory: 10Mi
This is a bit of housekeeping: we include the resources: to keep all components in the cluster equipped with resource data, and we use this to manage autoscaling later. See this article for details. You may need to adjust the values for your system. Consider using this Grafana Dashboard to check your system's values and adjust accordingly. The values here are for the nginx container.
livenessProbe:
  enabled: true
  initialDelaySeconds: 30
  timeoutSeconds: 5
  periodSeconds: 10
  failureThreshold: 6
  successThreshold: 1readinessProbe:
  enabled: true
  initialDelaySeconds: 5
  timeoutSeconds: 3
  periodSeconds: 5
  failureThreshold: 3
  successThreshold: 1
The livenessProbe and readinessProbe are good to have for live-cycle support, but we don’t dig deeper into that here. Have a look at this article for some more detail.
autoscaling:
  enabled: true
  minReplicas: "2"
  maxReplicas: "5"
  targetCPU: "80"
  targetMemory: ""
This section covers the autoscaling of the Nginx service: we start with two replicas, and scale up to five, adding replicas whenever the average CPU load compared to the CPU resource request is above 80%. We don’t trigger on memory consumption.
The Bitnami chart uses a Horizontal Pod Autoscaler for this, so enabling this creates one of these. Keda would do the same thing, so we could have also created a Keda ScaledObject and have the same effect. But here we opt to keep the local feature instead of creating another dependency.
Note that we don’t specify the replicaCount: attribute in the Helm values, as the autoscaler will bring it to two replicas right away. We can observe this event in the HPA event log, e.g. when using Lens: New size: 2; reason: Current number of replicas below Spec.MinReplicas.
If you want to check out the scaling, there is a custom dashboard pre-installed that shows the average CPU load and the number of replicas here.

Here we generated some load with ./nginx-traffic.sh which caused scaling up to three and going back to two after some cool-down period. In this case, we used the traffic generator in two terminals with ./nginx-traffic.sh 0 0.1. The little dent in the red and yellow line in the lower chart is a race condition where the calculation of the total CPU limit and request was not in sync with the query getting the number of pods — so this can be ignored, it should be flat. You can install ab which is part of the apache-utils package for more elaborate traffic generation.
cloneStaticSiteFromGit:
  enabled: false
  repository: "https://github.com/klaushofrichter/html"
  branch: "master"
  interval: 3600# this will be overwritten by the above GIT site if enabled above
staticSiteConfigmap: "nginx-html"
This is where the HTML content comes from: either a Git repository (you can use the one shown, or create your own), or a config map. If enabled, the Git repository will be cloned at the beginning with an init-container, and updated periodically by a sidecar, in this case: once an hour (3600 seconds).
The second option is a ConfigMap, which we create outside of this Helm chart from a directory. So you can place your own content in the directory ./nginx-html, and the ConfigMap will be created when calling ./nginx-index.html. Note that you need to disable the Git site in order to see the ConfigMap site.
We do a two-stage content deployment here: there is a simple HTML file that is placed in the ConfigMap before running helm. Then, once the Nginx pods are fully available, this ConfigMap is replaced with a more complex file to show the entry points and version IDs of many cluster components. As we take the version IDs from the Nginx executable itself, we will need to have the Pods up and running before getting the version of the executable.
service:
  type: ClusterIPingress:
  enabled: true
  pathType: Prefix
  hostname: localhost
  path: /
  annotations:
    kubernetes.io/ingress.class: nginx
The section above creates a Service for the Nginx pods with a ClusterIP, and an Ingress that works with ingress-nginx. Note that the path is /, which is a change to earlier versions of this overall cluster setup: We used to have Grafana on the root of the http://localhost:8080 endpoint, but now Grafana is at http://localhost:8080/grafana/ to make room for the Nginx page. That new home page includes links to all sub-components, including Grafana.
metrics:
  enabled: true
...
The remaining sections of the values file are related to the metrics exporter. There is a spec for the container, specific resources for the exporter, a ServiceMonitor spec so that Prometheus finds the metrics, and a PrometheusRule to generate an alert when a certain condition is detected. The alert would come to you via Slack if configured, see here for details.
The metrics coming out of the exporter are not too exciting, but you can have a look: if you are using Lens, you can proxy them out with a single click:

These metrics are used in the Grafana Dashboard shown a few paragaphs above.
If you generate some traffic, e.g. using ./nginx-traffic.sh 0 0.5 (infinite calls to http://localhost:8080/ with 0.5 seconds pause between calls), you can see some useful data on the Ingress “Performance” Dashboard after a few minutes, see the graph below. Note that there is a pull-down on the page where you can pick the Service that you want to look at, in this case it’s the Nginx service. This is part of the ingress-nginx installation and it does not rely on the Nginx metrics setting in the Helm chart.

Where to go from here?
We are only scratching the surface of the configuration options here. There are many more options in the Bitnami Nginx Helm Values file that you may want to explore. You can see all values that can be configured and their defaults when running this command:
helm show values bitnami/nginxAfter changing some values in nginx-values.yaml.template just run ./nginx-deploy.sh to replace the existing Nginx installation.
Looking at dynamic content or using Persistent Volumes is a good idea as well, now that you have a basis for exploration that you can use and hopefully have fun with.