Fluent-bit, InfluxDB, Grafana on K3D
This article is a follow-up to previous articles, this time adding logging capability to the K3D-based Kubernetes cluster. The aim of this setup is to provide a simple local setup for your own experiments, e.g. create dashboards or checkout configuration options.
As before, we have a quite simple NodeJS application and do a lot to instrument it for educational purposes. We keep all the features from the earlier articles. This is what the repository includes:
- Setup of K3D as local Kubernetes environment,
- a NodeJS application that creates custom metrics (and now processable logs),
- Grafana/Prometheus/Alertmanager with pre-installed dashboards (see this),
- Custom and off-the-shelf alert configuration with Slack for notification (see this),
- Ingress-Nginx with dashboard instead of Traefik for K3D (see this),
- …and new this time: Application Log processing with FluentBit and InfluxDB, plus a Grafana Dashboard exposing the NodeJS application log. FluentBit and InfluxDB are producing metrics themselves through metrics endpoints, and there is a web-based InfluxDB UI provisioned as well.
There are quite a few other changes in the setup compared to earlier articles, e.g. using exclusively Service Monitors for metric source discovery, leaner container building, different alerting rules, and a more modular approach to scripts. However, this current article focuses on log processing with Fluentbit, InfluxDB, and Grafana.
The concept of the setup remains the same as before: it’s all local on your machine, the installation is driven by bash scripts, with a single command start.sh to get going. There is no persistence (i.e. a cluster restart starts really fresh).
Update December 13, 2021: There is a follow-up article about logging that adds the use of Grafana Cloud / Loki to this setup.
Update February 13, 2022: There is a newer version of the software here with several updates.
What you need to bring
The setup is based on Docker 20.10, NodeJS 14.18, Helm 3, and K3D 5.0.1. Before getting started, you need to have the components mentioned above installed by following their standard installation procedures. The setup was tested Ubuntu 21.04, but other OSs will likely work as well. A basic understanding of bash, Docker, Kubernetes, Grafana, and NodeJS is expected. You will need a Slack account for receiving alert messages.
All source code is available at Github via https://github.com/klaushofrichter/fluentbit-influxdb. The source code includes bash scripts and NodeJS code. As always, you should inspect code like this before you execute it on your machine, to make sure that no bad things happen.
TL;DR
The quickstart is this:
- clone the repository and inspect the scripts (because you don’t want to run things like this without knowing what is happening).
- Edit
config.shper instructions in an earlier article or follow the comments in the config file itself. ./start.sh— this will take a while, perhaps 10 minutes or so, to set up everything.- Navigate with the browser to Grafana available at
http://localhost:8080by logging in (admin/operator), going to “manage” and selecting themyapp Application Informationdashboard. You may see something like this:

The top few panels show custom metadata from the NodeJS application, collected via Prometheus from the apps /metrics APIs. The lower two panels show data processed by FluentBit and collected by InfluxDB: the graph is the host CPU load, and the table shows log messages from the NodeJS application.
The following sections provide an overview of the files in the repository, discuss log generation in the NodeJS application, and show how the log processing with FluentBit, InfluxDB, and Grafana is configured.
What’s in the Repository
There are a lot of bash scripts, here is the run-down:
config.sh: this may be the one file you need to edit so that Slack messages for alerts work. Other values in the file should be ok to leave as they are. See the section “Preparing Slack” in an earlier article for some more detail. You can put the Slack link to a file and read it viacator reference it directly, e.g. like this:export SLACKWEBHOOK=”https://hooks.slack.com/services/T02F...UISnx”There are also some version numbers of helm charts. You may want to update as newer versions come out, but be aware that at times there are breaking changes.start.sh: this starts the setup by creating a K3D cluster and deploying the various components. The component deployment is done with extra scripts so that you can individually delete, create or updateingress-nginx,fluentbit,influxdb,prometheus, or the NodeJSapp. Each of these components has a deployment script and an un-deployment script that deletes the respective component from the cluster. Before deployment, un-deployment is automatically done.
At the end of the full deployment, you will see a few links which should work right then, an example is below:
export KUBECONFIG=/home/klaus/.k3d/kubeconfig-mycluster.yaml
Lens: monitoring/prom-kube-prometheus-stack-prometheus:9090/prom
myapp info API: http://localhost:8080/service/info
myapp random API: http://localhost:8080/service/random
myapp metrics API: http://localhost:8080/service/metrics
influxdb ui: http://localhost:31080
prometheus: http://localhost:8080/prom/targets
grafana: http://localhost:8080  (use admin/operator to login)
alertmanager: http://localhost:8080/alert- The first line shows the
KUBECONFIGthat you should use, it’s best to copy-paste this line into your terminal.
Thelensstring can be used to see metrics for the K3D cluster in Lens, see this article for details. Note that this was partly broken in Lens 5.1 for Cluster and Node level, but there was a fix for metrics to show again for Cluster and Nodes in Lens 5.3. A change inprom-values.yamlcompared to the previous article is also needed, which is implemented in this article’s repository.
You can use each of the following lines as links to localhost to go to the respective API with your browser:myappoffers three links as we have two implemented routes plus one for the metrics.influxdbis discussed in a different section below, andprometheus,alertmanagerandgrafanapoint to web UIs for the respective components.grafananeeds a login, as shown above, see this article for details. *-deploy.shand*.undeploy.shdeploys and undeploys the respective component. This would be useful if you change for example a value influentbit-values.yaml.template: just run./fluentbit-deploy.shto delete the existing deployment and create a new one, without setting up the whole cluster again.app-scale.shtakes a number like 1 or 3 to scale up and down the NodeJS application. This generates log entries, which you can observe in Grafana to test the log pipeline.app-traffic.shtakes a number like 2 or 20 and generates calls to theappAPIs, randomized betweeninfoandrandom. You can add a second number like 0.25 or 3 to indicate the time to wait between calls. An example would be:./app-traffic.sh 120 1which would generate one API call per second for two minutes.slack.shsends a slack message to the channel that is configured:./slack.sh "Hello Friends"is an example call.prom-crd.shinstalls Prometheus Customer Resource Definitions. The script is called bystart.shbecause we need some of these before deploying Prometheus, e.g.ServiceMonitors.
We are now looking at the NodeJS application (app-deploy.sh), FluentBit (fluentbit-deploy.sh), and InfluxDB (influxdb-deploy.sh).
Logging with NodeJS
The app-deploy.sh script creates a docker image from server.js, inserts it into K3D, and deploys the app with two replicas. We now look at the NodeJS code and see how the logging was done:
There are many choices for logging with NodeJS. In this setup, we are using Winston. Winston is convenient and easy to use, and it worked fine with the other pipeline components used here.
Taking a look at server.js, it is needed to require winston, and perform some configuration. In this code fragment, we are setting up a console output with the default log levels, which includes info, http and debug. See the Winston documentation for more details about this.
const winston = require("winston");
const logger = winston.createLogger({
  level: "debug",
  defaultMeta: {
    app: package.name,
    server: info.serverName,
    version: package.version
  },
  transports: [
    new winston.transports.Console({ level: "debug" })
  ]
});
The defaultMeta are strings that are included with each log output: here we include the application name and version (extracted from package.json) and a serverName, which is a generated human-friendly string that could aid you with tracking individual pods.
We define one transport only, which logs the debug and higher levels. The level definition is a bit redundant here, as we have a default level for the whole logger, but it’s good to see that this can be customized.
In the code you can use the logger like this:
worker.get("/service/random", (req, res) => {
  logger.http("/service/random");
  var r=Math.floor((Math.random()*100));
  logger.debug("random value generated: "+r);
  res.status(200).send({ random: r });
});
Here we output a http level message to show in the logs that an API was called, and we output a debug log message that records the random number that we are delivering back to the API caller as result.
That’s it, and it is not much different from using console.log, but so much more powerful. Log output on the console shows JSON format, you can see this with node server.js.
Fluentbit processes logs
fluentbit-deploy.sh deploys fluentbit through a Helm chart. The magic is in the values file fluentbit-values.yaml.template. Without explaining the whole file, there are a few important sections at the end: Where does Fluentbit read logs from, how is the data processed, and where does it go. These are the sections [INPUT], [FILTER] and [OUTPUT] towards the end of the file.
INPUT: In the example here, we are reading CPU load and log data from our NodeJS application, so there are two [INPUT] sections. It’s pretty self-explaining, but noteworthy are these elements:
Tag ${APP} adds a tag to the input stream from our NodeJS application. This is used to attach the following processing steps to the specific stream, in our case either host_cpu or myapp (unless the app name changes).
Note that the ${APP} is substituted by the application name that is extracted from the package.json file. That’s why we have a *.yaml.template values file, it needs processing with envsubst before it can be used with Helm. The ${APP} is also used to pinpoint the log source, which is a tail operation on log files matching the name of the container log, /var/log/containers/${APP}-deploy-*.log. There are as many log files as we have instances of the application, but the wildcard will catch them all. We can separate them later through the pod name attribute.
FILTER: The filters apply to the stream with a matching Tag, and in our example, we have two filters for the ${APP} stream. The first parses the JSON data structure that is generated by Winston into individual elements, and the second removes some of the elements that are not used later. Some of the Winston log lines will have nested JSON, this parser only takes care of the first level. You will see some log messages in JSON format.
OUTPUT: The output passes the streams to suitable receivers, in this case, we are using the same InfluxDB and the same database for both the CPU measurements as well as the NodeJS application logs.
Here are a few more comments about the fluentbit-values.yaml.template file: We enable a service monitor so that Prometheus can gather metrics about FluentBit itself, and we are using a debug image for FluentBit that has the advantage of offering a shell so that we can kubectl exec into it for debugging. Another interesting thing is the machine-id: FluentBit would like to see the local machine-id (/etc/machine-id on Linux). While this is not really essential here, we are exporting the real hosts /etc/machine-id file through a configmap, and use the subpath directive to mount the one file directly into /etc in the FluentBit container.
We also enable metrics, set up a ServiceMonitor, and installed a dashboard for FluentBit in Grafana.
InfluxDB to store the logs
We have used InfluxDB as a target for the FluentBit output, so here are some of the InfluxDB deployment details. We use a Helm chart for the installation, along with a very simple influxdb-values.yaml file. The values file is not one that should be used for production environments at all: we open the database to the outside through a NodePort, define a default user, and create a database. As a consequence, this is not a secure setup, but for our purpose, it is good enough. The default user means that you don’t need any authentication at all, but in order to prepare for a distant future, the user and password details are used where they would be needed throughout the setup.
There are two relevant additions to the plain InfluxDB setup: a user interface and a metrics exporter:
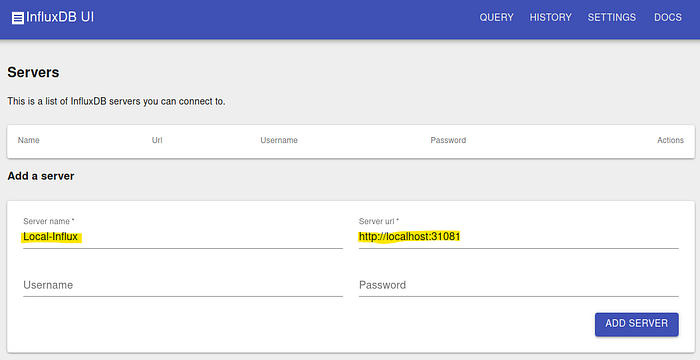
InfluxDB UI: InfluxDB used to come with a web-based UI, but it was discontinued at some time. A UI is less needed for operations, but useful for development and debugging. There are quite a few solutions available, here we go with an open-source solution by Dan Esparza through GitHub (Thanks Dan). A related docker image is deployed along with InfluxDB, and this is why we needed to have a NodePort, see influxdb-ui.yaml.template. Once you have a running cluster, you can go to the address http://localhost:31080 to access the UI.
To visualize the InfluxDB data with the US, you need to go to settings and configure the database access URL http://localhost:31081. As we have used a default user, there is no need to enter a username or password here. You can pick your own DB name. Note that 31081 is the NodePort that was created for InfluxDB via the values file and a subsequent kubectl patch command, while 31080 is the port that is used for the UI. In k3d-config.yaml.template both ports are made available outside of the cluster.
Once the settings are done, go back to the InfluxDB UI itself, and type in a query: select * from myapp:
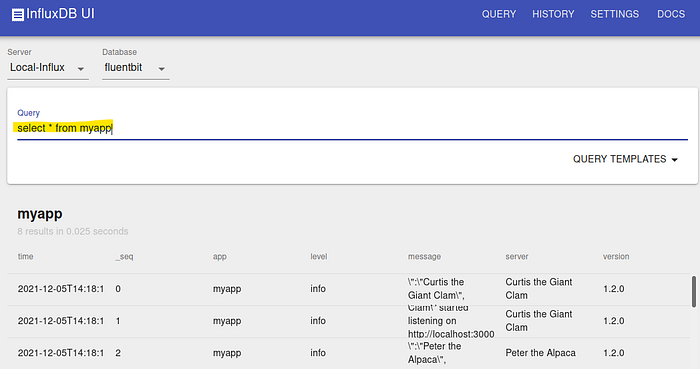
If things worked well, you should see the initial log entries. With select * from host_cpu you can see the CPU data.
InfluxDB Stats Exporter: InfluxDB has its own /metrics interface that can be scraped by Prometheus. However, this API provides mainly development-related metrics and no information about the database operations itself. There is an Influx command show stats that you can type into the InfluxUI, which gives quite some insight into InfluxDB’s database details, but that’s not available through /metrics.
Thankfully, there is a helper application provided by Carl Pettersson through GitHub that exports the original InfluxDB metrics plus the data you receive via show stats (Thanks Carl). We deploy a docker image of the InfluxDB stats exporter, create a ServiceMonitor, and add a Grafana dashboard to visualize the InfluxDB metrics through influxdb-stats-exporter.yaml.template. As a result, we can see a lot of InfluxDB details through a Grafana dashboard.
Grafana Dashboard with Logs and Metrics
Grafana is set up along with Prometheus and Alertmanager through a Helm chart, with heavy customization both through the values file and post-processing of Dashboards. This was partly explained in earlier articles. Noteworthy are the new dashboards for Fluentbit and InfluxDB, with the latter one fed by the specifically installed InfluxDB-stats-exporter.
The custom dashboard is based on an earlier version, but with the addition of data coming from the InfluxDB data source in the lower half, as explained in the TL;DR section.
The InfluxDB data source itself is configured as additionalDataSources in prom-values.yaml.template:
additionalDataSources:
  - name: InfluxDB_InfluxQL
    type: influxdb
    url: http://influxdb.influxdb:8086
    database: fluentbit
Note that the URL is a Cluster-internal service and so this does not rely on the NodePort that we used to make InfluxDB accessible from outside of the cluster.
With this specification, a new data source InfluxDB_InfluxQL shows up as an available Grafana data source when creating a new panel for a dashboard. Data sources are panel-specific and so these can be mixed with other panels on the same Dashboard.
Here we added one time-series panel using the host_cpu measurements available through the InfluxBD data source, and a table panel with log entries from the myapp measurements. In both cases, we are using the InfluxQL query language to extract the right data from InfluxDB. Below is a screenshot of the dashboard editor for the log entries.
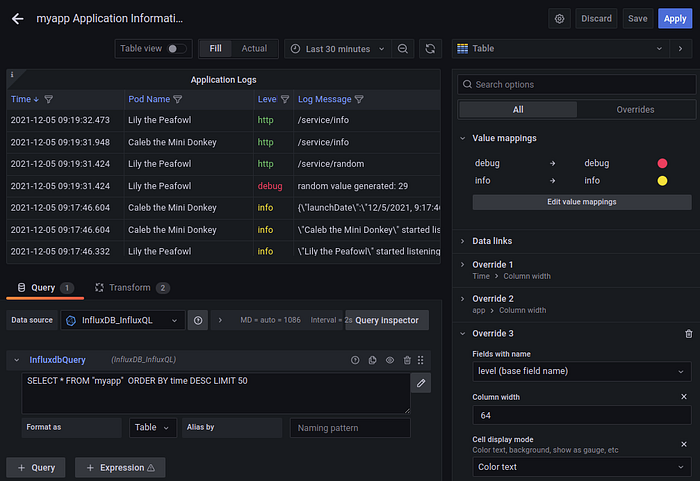
You can see the InfluxQL statement that drives the table — the very same statement can be tested in the InfluxDB UI interactively, although Grafana also provides real-time feedback with live data as you edit a panel. The screenshot shows also some of the detail work, such as colored text for different log levels or some overwrites of columns and legends.
Where to go from here?
You can now start your own experiments: For example, after changing some FluentBit parameters in fluentbit-values.yaml.template, you only need to call ./fluentbit-deploy.sh, and after a short while, you should see the effects. The same applies to the other components.
This newer version of the K3D based cluster has a lot of things going on, but a lot of improvements or additions are possible. Possibly future articles may cover some of that. For example:
- Use FluentBit’s Kubernetes specific Filters and Parsers.
- Alerting based on InfluxDB data.
- Add logs from other system components, such as ingress-nginx or Kubernetes system components.
- Bring in Persistent Volumes (right now, it is all in memory, a cluster restart will remove all data).
In the meantime, have fun with experimentation.