Mostly static metrics with NodeJS, Kubernetes, and Grafana
That’s an odd title… what are mostly static metrics anyway? It sounds boring, but there are metrics that don’t change that often, such as application version numbers. To demonstrate how to expose these, here is a tutorial about how to display mostly static metrics of NodeJS applications in Kubernetes within a Grafana dashboard.
This is a beginner's guide, focused on the demonstration of the concept — you will build a nice small environment that shows how to do it, and hopefully, you can take some ideas with you to solve your real-world problems.
What you need to bring
The setup uses Minikube 1.23, Docker 20.10, NodeJS 14.17, Helm3, and the latest versions of various tools and libraries. Older or newer versions of the components mentioned above will most likely do fine.
Before getting started, you need to have the items mentioned above installed by following the standard installation procedures. The article uses Ubuntu 21.04 as OS, but other OSs will likely work as well. A basic understanding of bash, Docker, Kubernetes, Grafana, and NodeJS is expected.
All source code is available at Github via https://github.com/klaushofrichter/grafana-nodejs. The source code includes a bash script and NodeJS code. As always, you should inspect code like this before you execute it on your machine, to make sure that no bad things happen.
September 27, 2021: Update to the original sources in the repository: added a few patches in values.yaml.template and start.sh to enable proper Prometheus stats for etcd, kube-scheduler, and kube-controller-manager — this is Minikube specific. All dashboards preloaded by the Prometheus community stack are now producing metrics in Grafana.
Static Metrics
Examples of static metrics are things like version numbers or build dates, i.e. information that does not really need to be tracked by the minute, and that does not need to or cannot be aggregated. But at times it is useful to integrate such data with Grafana dashboards, e.g. to show which builds are currently used related to other metrics such as CPU usage. Here is a simple dashboard example that shows an application name and a version number, as well as the “launch date” and “server name” of individual pods.
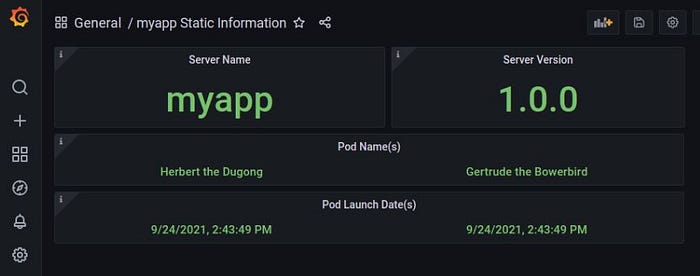
It’s easy to understand what a “Pod Launch Date” would be (it’s the time the server was launched), but what’s a Pod Name? In this example, the NodeJS application explained below generates a unique but somewhat memorable name per Pod when launched — this is useful as an example for static metrics, but also suitable in real-life to identify Pods by nicknames instead of something like “myapp-deploy-758cbbf955–5q227” during development.
TL;DR
To get started really fast without the overhead: just clone the repository, review start.sh and server.js, and run the bash script ./start.sh in a terminal. If things go well, after a few minutes, you should see instructions about how to launch Grafana with minikube service myapp-grafana -n monitoring. Use the Grafana user admin and the password operator as shown in the onscreen instructions. You will then manually install the generated dashboard static-info-dashboard.json in Grafana, or you can pick the dashboard when going to “manage” and select “myapp Static Information”. in both cases, something like the screenshot above should show up.
NodeJS Application
We are going to use a very simple NodeJS application that offers two REST APIs: one provides some information about the server and one that generates a random number. We are also implementing a third API to provide the metrics that are used by Grafana. This third API is somewhat implicit, as it is provided by a library called prom-bundle as part of the NodeJS application.
After cloning the repository, you could launch the server stand-alone for testing. That creates a server listening on port 3000, and it outputs some information about the server:
$ node server.js
server listening on http://localhost:3000/info:
{
  launchDate: '9/22/2021, 4:30:07 PM',
  serverName: 'Hulda the Crane Fly',
  appName: 'myapp',
  serverVersion: '1.0.0'
}
The output is already the static data that we are going to show in Grafana later:
launchDateandserverNameare generated when the server starts. Launching the server again will show a more recent current date and another name.appNameandserverVersionare extracted frompackage.json, i.e. launching the server again will show the same detail, unlesspackage.jsonis updated.
Then you can access the APIs through curl or through your browser: http://localhost/info returns the same JSON data that we saw during the launch of the server, http://localhost/random generates a random number (this is the service that the server provides!) and http://localhost/metrics provides information that Grafana uses for metrics display.
$ curl http://localhost:3000/info
{"launchDate":"9/22/2021, 4:30:07 PM","serverName":"Hulda the Crane Fly","appName":"myapp","serverVersion":"1.0.0"}$ curl http://localhost:3000/random
{"random":77}$ curl http://localhost:3000/metrics
# HELP myapp_http_request_duration_seconds duration histogram of http responses labeled with: status_code, method, path
# TYPE myapp_http_request_duration_seconds histogram
myapp_http_request_duration_seconds_bucket{le="0.003",status_code="200",method="GET",path="/info"} 0
myapp_http_request_duration_seconds_bucket{le="0.03",status_code="200",method="GET",path="/info"} 1
   ...deleted many similar lines...
myapp_http_request_duration_seconds_count{status_code="200",method="GET",path="/random"} 1

# HELP up 1 = up, 0 = not up
# TYPE up gauge
up 1

# HELP myapp_server_info myapp server info provides build and runtime information
# TYPE myapp_server_info gauge
myapp_server_info{launchDate="9/22/2021, 4:30:07 PM",serverName="Hulda the Crane Fly",appName="myapp",serverVersion="1.0.0"} 1
Some more detail about the /metrics: the first section is metrics related to HTTP calls, which we don’t cover here in more detail. The second section is another standard metric that can be used for health checks. The third metric is again the JSON object that we saw before. However, it has a name here, myapp_server_info, and it is delivered through the metrics API.
The aim of this article is to explain how this data ended up there and how to show this in Grafana. Let’s have a look at the NodeJS application now and cover the Grafana dashboard configuration in a later section.
The key ingredient for the NodeJS application is a package called express-prom-bundle and prom-client. We’ll focus on the usage of these and ignore the details of the remaining application.
express-prom-bundle allows NodeJS Express apps to conveniently generate Grafana compatible metrics. Very little work is needed on the application side, and all metrics generated for the express routes can be read through the /metrics API.
const promBundle = require("express-prom-bundle");
const metricsMiddleware = promBundle({
  includePath: true,
  includeMethod: true,
  includeUp: true,
  httpDurationMetricName: package.name +
     "_http_request_duration_seconds",
});
worker.use("/*", metricsMiddleware);
The code fragment above defines which parameters the metrics should include on top of some defaults. includePath allows filtering HTTP requests metrics for /info or /random. includeMethod adds POST or GET to the filter options, and includeUp causes the up metric to be generated. We also define a custom metric name to be used for queries later by combining the app name taken from package.json with the standard name for this type of metric. The use() call applies this configuration to all matching express routes.
const prom = require("prom-client");
const infoGauge = new prom.Gauge({
  name: package.name + "_server_info",
  help: package.name + " server info provides build and runtime
    information",
  labelNames: [
    "launchDate",
    "serverName",
    "appName",
    "serverVersion",
  ],
});
infoGauge.set(info, 1);
prom.register.metrics();
prom-client defines custom metrics, and this is where we are using the JSON data structure shown a few times already as the source. The code fragment above defines a Gauge with a name and a help-text, as well as an array of key values that should be exposed. We are using the elements from the JSON document called info that we have seen before. We are inserting the data once with set and register the metrics.
With that, we are all set… the Express routes are now supporting metrics generation, including the custom metric structure for the “static metric” defined by info.
Deployment of App and Grafana to Kubernetes
Now we need to deploy the application to Kubernetes and install Grafana as well. For the application deployment, we need to build an application container and create the Kubernetes deployment YAML specification. There is a file app.yaml.template in the repository which defines a deployment with two pods, a service, and two namespaces — one for the app and one for Prometheus/Grafana. The file is parametrized, i.e. to generate a valid YAML spec, certain environment variables need to be defined and applied with envsubst.
Prometheus/Grafana can be easily deployed using the popular Prometheus-Community Helm chart. We do some customization of the Helm chart by using helm’s --values option: this option allows to add configuration parameters or overwrite default values. In the start.sh script, this is done by piping a JSON file into the helm install command after resolving some variables with envsubst. Specifically, in our case, we overwrite the default Grafana password and add two additionalScrapeConfigs jobs to Prometheus. One of them is targeting the Pods that are deployed, and the other is targeting the Service that we configured to expose the Pods APIs. We are using label matching as the selector mechanism.
The steps described above (build container, deploy the application, run helm) are all done in a bash script start.sh, which also initializes a Minikube cluster: Once you run the start.sh script, it will do following things within a few minutes:
- stop and delete an existing Minikube cluster (to ensure a fresh start)
- start a new Minikube cluster
- install node_modules to build the NodeJS application
- build a container for the application
- deploy the app according to the YAML specification
- use helm to install the
prometheus-communitystack including Grafana - convert some ClusterPorts to NodePorts
- show a selection of commands that can be used on the command line to access the app or Grafana.
If things go well, you can access the application's APIs through the URL shown on-screen, e.g. http://192.168.49.2:31998/info — your IP address and port will vary. You can access Grafana by using these commands:
export KUBECONFIG=~/.kube/app.config
minikube service myapp-grafana -n monitoring
The Grafana username is admin and the pre-configured password is operator. Once logged in, you can navigate to the “manage” screen and select one of the pre-configured dashboards to start looking into your Kubernetes cluster.
Grafana Dashboard
While the predefined dashboards provide useful information and are good-looking in most cases: we are trying to expose the custom static metrics. Here is how to do that step-by-step from scratch.
But as this is a bit lengthy, you can also import the dashboard static-info-dashboard.jsonthat was generated in JSON format when running the start.sh script and skip this section…
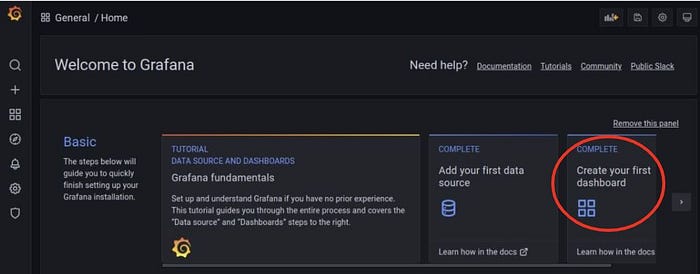
The above screenshot is the Grafana Home Screen that you see after login. We want to create our own Dashboard, so you should use that option shown above.
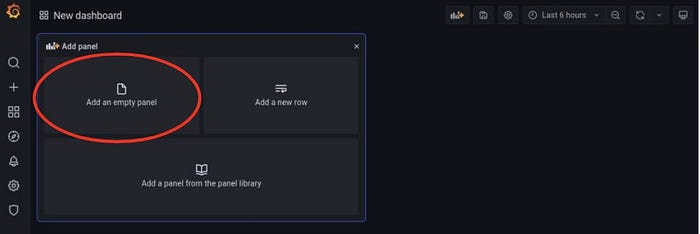
Click “Add an empty panel”, because we are going to create a new panel to be populated with the custom metrics.
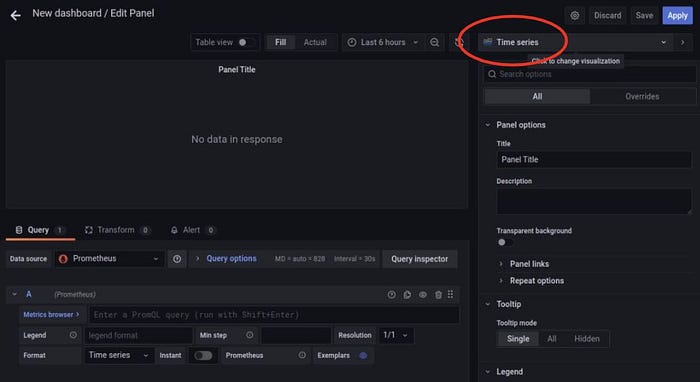
This is a pretty busy screen. The panel that we work on in the top left is empty, changes that we do in the configuration will be displayed in real-time based on the actual data.
The first thing we need to do is to pick a proper panel type — the default is “time series”. Clicking on that shows other options:
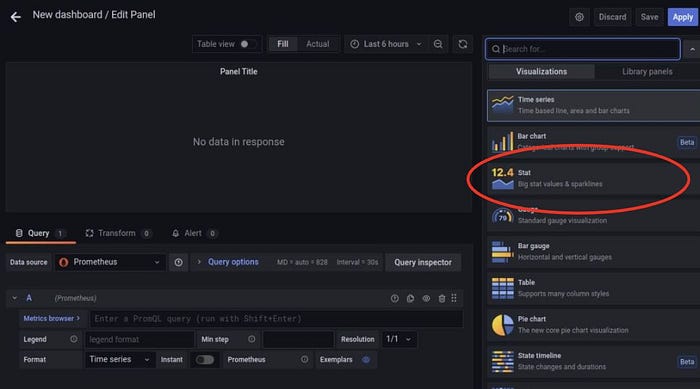
For our purpose, we are selecting “Stat”. Once clicked, the screen changes to give access to parameters related to the Stat Panel type on the left side.
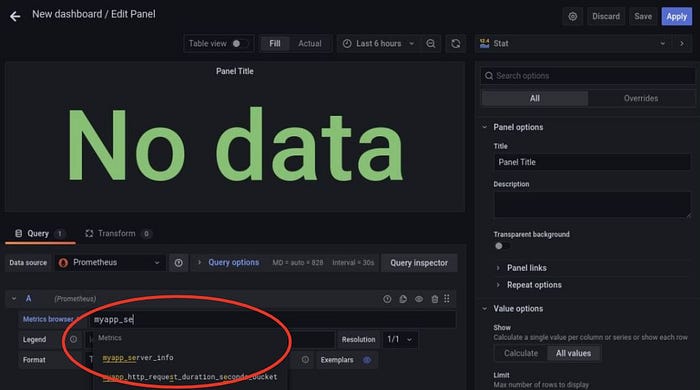
It shows “No data” because we have not picked any data source yet. We do that by adding a query. In the screen above, the letters “myapp_se” were already typed, and matching options are shown underneath. In our case, we want to access the JSON object “myapp_server_info”, which matches the JSON object name we used in the NodeJS application when we defined the infoGauge object.
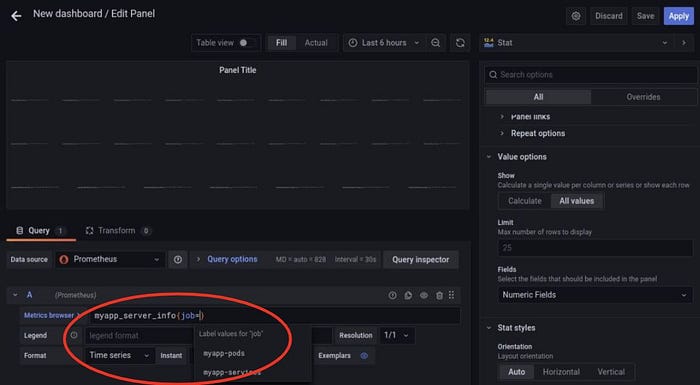
myapp_server_info comes from several sources, called jobs, which have been defined through the helm --values option. We are now selecting the proper source by adding the parameter job="myapp-services". This means that we pick the service API as the source and not the pod API. The alternative job="myapp_pods" would have worked as well, but as we have two pods, we would see two entries. That is in some cases the desired outcome — for example, using the launchDateas metric: the Pods should have different launch dates — this can be seen in the example screenshot in the very beginning. But we go after the appName, which is supposed to be the same across pods.
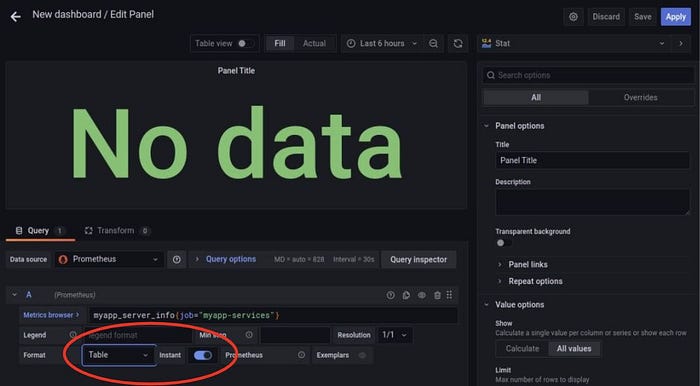
In our case, we also need to select Tableas format and turn on instant.
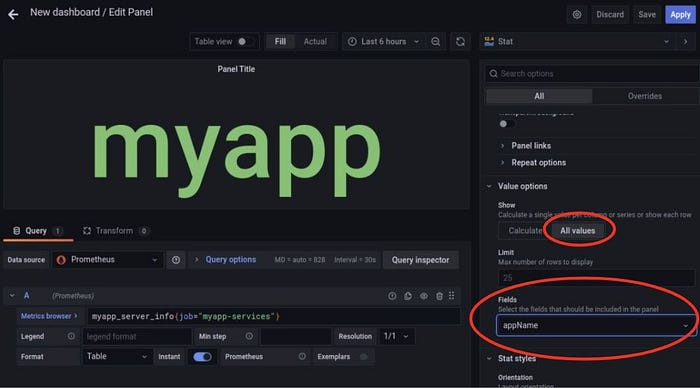
The query that we formulated includes a lot of data, including all of the custom metrics in the info object from the NodeJS application. We need to pick the one we want to see, in the case appName. Go to the right side, and select AllValues and appName as shown.
And just like that… the application name, originally written in package.json, is showing as real-time metric in Grafana. After that, use “apply” in the top right.
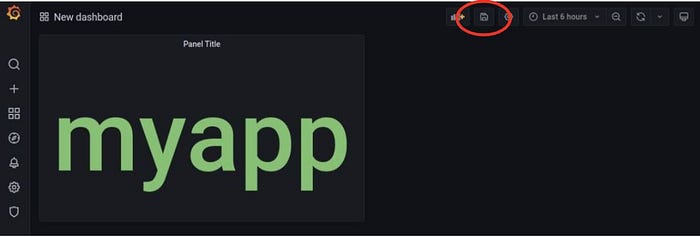
One of the panels from the full example is done, the new panel shows the app name. This is without finetuning, such as panel name, help text, or font sizes. If you did not save, you should do it now.

After saving, you should now select the share option, and export the JSON description of the dashboard to your local file system. Note that this system setup does not include persistent storage, so a restart of the cluster will remove all editing, including the Dashboard we just created.
The screen shown at the very beginning of this article (see static-info-dashboard.json) includes a few more of the metrics, with queries targeting Pods and Services, and some panel layout arrangements. This is not complicated to achieve through the Grafana dashboard editing tools.
Where to go from here
This article covers the whole path from NodeJS application development to deployment in Kubernetes to Grafana Dashboard creation. We focussed on “static metric”, but the whole framework can be used for more experimentation such as dynamic custom metrics or different dashboards. Other development could cover the Alertmanager that is included with the prometheus-community stack or Kubernetes Horizontal Autoscaling based on custom metrics. Adding persistent storage for Grafana is also possible so that the configuration survives a restart of the cluster. Happy coding!
This Minikube setup is limited to local usage. You could use Kubernetes Ingress and other configuration to expose the APIs to the public Internet, but that’s possibly dangerous. If you know how to handle this, here is an article that shows how to connect Minikube services to the Internet and implement HTTPS or add OAuth2 authentication.
