K3D Metrics for Lens
The pretty popular Lens Kubernetes IDE offers not only a lot of Kubernetes setup details but also metrics — it even conveniently deploys Prometheus with a click when needed. But what if there is a Prometheus instance already running? Here is what to do on K3D.
This article covers a complete K3D example, but most of it is probably transferable to other Kubernetes solutions. The article is based on a previous article covering custom Grafana Dashboards — but with a relevant change: now using K3D instead of Minikube.
Update December 6, 2021: something changed in Lens, and a different configuration for the node-exporter ServiceMonitor is needed for Lens version 5.3 or later. See the discussion here, and the change in Github. Note that there is an overall update of the setup described in this article in a newer posting, so it is recommended to use that article's repository which also supports the new Lens setting.
Update February 13, 2022: There is a newer version of the software here with several updates.
What you need to bring
This setup is based on Docker 20.10, NodeJS 14.17, Helm3, and K3D 5.0.1 (note that K3D 5.x includes breaking changes to the previous K3D configuration file format). Lens 5.2 should be available.
Before getting started, you need to have the items mentioned above installed by following the standard installation procedures. The article uses Ubuntu 21.04 as OS, but other OSs will likely work as well. A basic understanding of bash, Docker, Kubernetes, Grafana, and NodeJS is expected.
All source code is available at Github via https://github.com/klaushofrichter/k3d-prometheus-lens. The source code includes a bash script and NodeJS code. As always, you should inspect code like this before you execute it on your machine, to make sure that no bad things happen.
Lens and Metrics
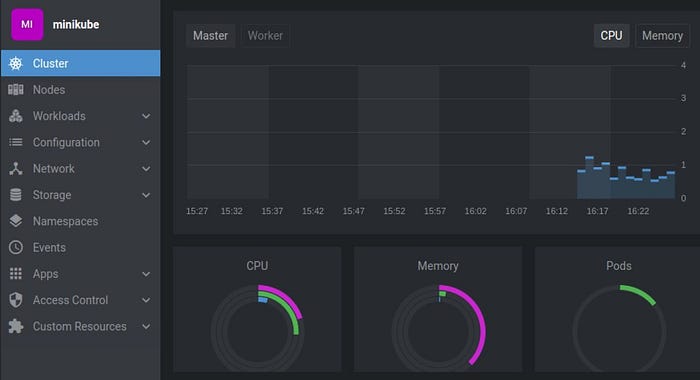
The focus of the article is on a K3D cluster showing metrics in Lens. Out of the box, you can request Lens to deploy Prometheus for you, or it detects existing metrics servers, for example in Minikube. That’s great, and nice metrics show up in the Lens UI, but not so in K3D.

Even when using K3D with Prometheus installed, no metrics show up out of the box. Lens does not easily detect Prometheus due to some label mismatch: the Lens documentation refers to this detail here and there is community discussion about this in many places.
The example covered in this article includes the full package: setup a K3D cluster, deploy a NodeJS app with custom metrics, and install kube-prometheus-stack which includes Prometheus and Grafana. The label configuration needed for Lens is also applied so that K3D should work with Lens.
TL;DR
To get started really fast without the overhead: clone the repository, review start.sh and server.js, and run the bash script ./start.sh in a terminal. If things go well, after a few minutes, you should see instructions on the screen:
export KUBECONFIG=/home/YOU/.k3d/kubeconfig-mycluster.yaml
Lens: monitoring/prom-kube-prometheus-stack-prometheus:9090/prom
myapp info API: http://localhost:8080/service/info
myapp random API: http://localhost:8080/service/random
myapp metrics API: http://localhost:8080/service/metrics
prometheus: http://localhost:8080/prom
alertmanager: http://localhost:8080/alert
grafana: http://localhost:8080  (use admin/operator to login)
You will now need to launch Lens, and pick the menu File/Add Cluster. This will open an entry field where you can paste the content of the kubernetes configuration file for the new cluster — the file location is likely ~/.k3d/kubeconfig-mycluster.yaml, as shown in the first line of the instructions above.
You should see your new cluster towards the bottom of the list that shows up, and you need to use the three-dot-menu on the right of your clusters entry to go to Settings.
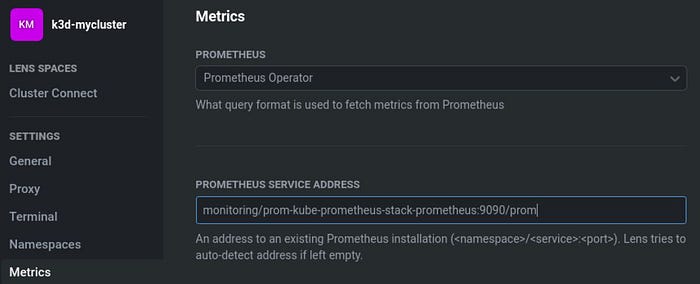
On the settings page, pick metrics and from the dropdown Prometheus Operator. Then enter monitoring/prom-kube-prometheus-stack-prometheus:9090/prom as shown on the second line from the instructions.

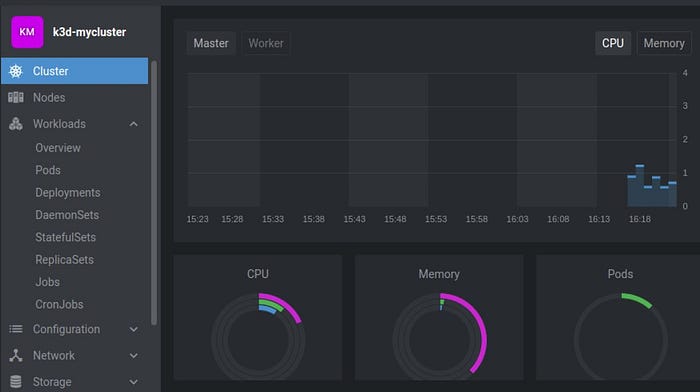
With that, you are back on the list of services, and you can use the three-dot-menu again, this time to connect. Metrics from your own Prometheus instance should show up.

What Else Is There?
The short instructions above cover what needs to be done to get this working… now here are some more details about what is happening in the ./start.sh script.
The ./start.sh script performs a few things on top of the Prometheus configuration to make metrics show in Lens:
- k3d create: most of the K3D configuration is done via a configuration file, see
k3d-config.yaml.template. The config file includes some environment variables that are resolved withenvsubst. This is done for other configuration files in this example as well. - ingress-nginx: Traefik is disabled in the configuration file, and
ingress-nginxis installed instead via a helm chart. After the helm installation process, we have a fewkubectl rolloutlines and an active loop to wait for the ingress to receive an IP address. This is not really needed, but sometimes it is better to complete an installation step before moving on. The same happens with the other steps below. - kube-prometheus-stack: this installs Prometheus, Grafana and Alertmanager via helm. The values file
prom-values.yaml.templateincludes the previously mentioned relabel instructions that would make the Prometheus metrics available to Lens. There is also the definition of additional scrapes for the custom metrics coming from the NodeJS application, and a route prefix for Prometheus and Alertmanager paths. This allows serving everything from the same port. Ingresses for Grafana, Prometheus and Alertmanager are defined as well, plus some smaller things like Grafana password and default timezone. - Node JS Application: the NodeJS application is basically the same as in the previous article, bringing custom metrics to Prometheus and Grafana, while performing the simple service of generating a random number. After building the application image, it is imported to K3D via
k3d image import. For some reason, K3D would not pick this up from the docker instance directly, which would appear to me as a common use case. - Everything on localhost:8080: At the end, all services including Grafana, Prometheus, Alertmanager, and the various application APIs are exposed through a single port, separated through routes. In the case of Prometheus, the route prefix
promis part of the Lens configuration to access metrics via Prometheus.
Minikube vs. K3d
The whole exercise was triggered by my switch from Minikube to K3D. Minikube is working very well and it is very stable, but I was moving to K3D to eventually give “Kubernetes on Raspberry Pi” a try. Minikube is not an option on that hardware… Here are some thoughts:
- K3D is younger than Minikube and less mature. For example, I could not get Filesystem metrics to work yet, and breaking changes can be expected more frequently.
- Minikube is harder to get connected to the public Internet, some previous articles covered that struggle, using
virtualboxas a backdoor. That’s inconvenient, to say the least. - Both systems are pretty stable and reliable. After creating the cluster and the nodes, there is not much difference to see between them for the hobbyist or student of Kubernetes.
Competition is a good thing :-)
